Casino Slot Machine Analytics: Turning Spin Data into Profit
The modern casino floor is no longer ruled by intuition alone—it is governed by data. Casino slot machine analytics has evolved from simple win/loss tracking into a sophisticated discipline that predicts player behavior, optimizes floor layouts, and maximizes lifetime value. Operators who ignore these metrics leave millions on the table. This guide dissects the core KPIs, predictive models, and real-world implementation strategies that separate industry leaders from laggards.
Key Performance Indicators (KPIs) That Define Slot Success
Revenue is a lagging indicator; operational data is the leading edge. To truly harness casino slot machine analytics, you must monitor a specific set of metrics daily.
The Critical Metrics
- Win per Unit per Day (WUD): The gold standard. Measures net win per machine per 24 hours.
- Average Theoretical Win (ATW): The expected house edge percentage (e.g., 8-12% for slots).
- Coin-In per Day: Total wagered amount. Indicates player engagement, not profit.
- Player Session Length & Frequency: Measures stickiness and habit formation.
- Hold Percentage: Actual win divided by coin-in. Compares performance against theoretical hold.
- Uptime / Machine Utilization: Time the machine was actively accepting play.
Performance Benchmark Table
| Metric | Poor (Alert) | Average (Monitor) | Excellent (Scale) |
|---|---|---|---|
| WUD | < $150 | $250 — $400 | > $600 |
| Hold % vs. Theo | < 70% | 85% — 95% | 100% — 110% |
| Coin-In/Day | < $2,000 | $4,000 — $7,000 | > $10,000 |
| Floor Move Rate | > 25% variance | < 10% variance | Stable trending up |
Predictive Modeling: Player Segmentation and Churn
Static reports are history. Predictive slot machine analytics uses historical spinning data to forecast future action. This involves clustering players into micro-segments based on theoretical loss velocity and game volatility tolerance.
Profitability Clusters
- High-Roller / High-Volatility: Low spin frequency, massive bet size (max lines). Focus on comps and exclusive enclosures.
- Grinder / Low-Volatility: High spin frequency, low bet size. Value comes from session time eating into odds.
- Bonus Hunter: Switches machines after hitting a feature. Target with targeted free-spin offers to return.
Next-Play Prediction: By analyzing the time since last visit and average daily coin-in, the system can issue a «win-back» coupon before the churn probability exceeds 60%, rather than after the player has defected.
Operational Efficiency: Floor Optimization and Configuration
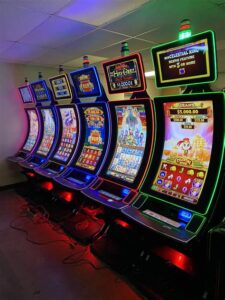
The physical layout and game math are data points, not static choices.
| Decision | Data Input | Action |
|---|---|---|
| Game Selection | Variance %, Hit Frequency, RTP | Place high-volatility games near high-footfall areas for spectators. |
| Bank Placement | Revenue per square foot / machine power draw | Relocate underperformers (WUD < 30%) to the "dead zone" or sell them. |
| Denomination Mix | Average wager per player segment | Cluster $0.01 and $0.05 machines separately to prevent cannibalization. |
…